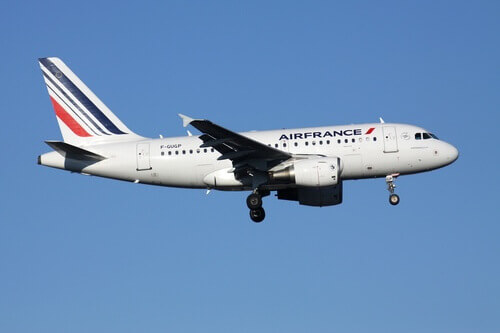
Air France-KLM Shares Drop 2.5%, Marking the Lowest Performance in the SBF 120
The stock of the Franco-Dutch company experiences a sharp halt in mid-morning trading, following several weeks of uninterrupted ascent. The stock loses ground in a downward trending Parisian market, recording one of the most significant declines in the broader index. The exceptional rally of recent months gives way to profit-taking.
Air France-KLM shares drop 2.83% to €13.59 in mid-morning trading, becoming the worst performer in the SBF 120, which is down 0.37%. This session contrasts with recent dynamics: the stock is still up +9% over the week and +55.3% over three months, following a surge of nearly 3% in the last session. The company is supported by a solid underlying momentum: its successful issuance of a €500 million senior bond last week, and the signing in June of a €1 billion credit line with twelve international banks, demonstrate significantly relaxed access to financing markets.
RSI at 79 and Price Over 24% Above the 200-Day Moving Average
Free · Every morning
Technical market signals, before the opening bell.
Bullish and bearish momentum, analyst changes, stocks to watch — automatically computed from Euronext data.
✓ Before 9 AM every morning✓ Euronext data✓ AI-powered analysis
You're in — subscription confirmed!
Your first edition is on its way. Check your spam folder and add us to your contacts.
An error occurred.
Indicative data. No investment advice. Unsubscribe at any time.
Gratuit · chaque matin
Ne ratez plus rien sur vos actions
La tendance derrière les cours. L'essentiel des valeurs Euronext en quelques minutes.
📈les valeurs en mouvement, sur la durée
🎯les objectifs d'analystes qui évoluent
📰les actualités qui font bouger les cours
tendance · 6 séances
✓ C'est fait, vous êtes inscrit !
Votre première édition arrive bientôt. Pensez à vérifier vos spams.
Une erreur est survenue.
CAC 40 · SBF 120 · données indicatives · aucun conseil en investissement · désinscription à tout moment.
Today's decline occurs in an overbought setup. An RSI of 79 indicates the tension accumulated by the stock after its steep ascent, while the price remains more than 24% above its 200-day moving average (€10.94) and nearly 25% above its 50-day moving average (€10.87). The gap from the long moving averages, combined with the RSI level, mechanically explains the stock's sensitivity to profit-taking. The resistance identified at €13.98, corresponding to the last closing, was tested during the session, with the stock closing below this level. In terms of valuation, the consensus of analyst opinions places the stock around 4.2 times the earnings expected for the current fiscal year, and 2.8 times those of the following year. The medium-term trajectory remains largely positive, with performance exceeding 49% over one year, but the stock will need to digest the extent of its rally before attempting a new breakthrough of the €14 zone.
Approche agile ; perspectives 2026 révisées en termes de capacité ; environnement particulièrement volatil
Outlook / guidance
Management commentary: La facture carburant attendue devrait atteindre 8,9 milliards de dollars US sur l'exercice 2026
The information presented in this article is provided for informational purposes only and does not constitute an investment recommendation, an incentive to buy or sell a financial asset, or investment advice. Readers are invited to conduct their own research before making any decision.
Investments in the stock market involve risks, including the risk of capital loss. Past performance of an asset or market is no guarantee of future results. Any investment decision should be made taking into account your personal financial situation, objectives and risk tolerance.