Idéal Investisseur
Français English
CAC 40 : Market open
8 452,74 pts
+0.96%


Last updated : 27/07/2026 - 13h10
🏠 Home   ➤    Stock news

Safran Shares Soar 22.5% Over a Month, Targeting €347.20

The aerospace engine manufacturer continues its forward march and stands out as one of the CAC 40's leading stocks in mid-morning trading. The stock is in a sustained upward trend over several sessions, fueled by both industrial announcements and a more peaceful geopolitical environment.
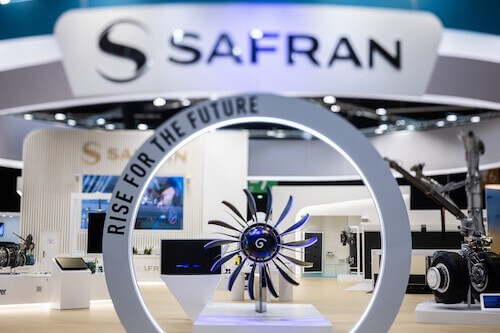

Safran Shares Soar 22.5% Over a Month, Targeting €347.20

The Stock Widens the Gap with Its Moving Averages, Reaching a Peak of €332.50

Safran's stock has risen by 2.62% to €332.50, among the highest gains in the CAC 40, which is up by 0.42%. The resistance at €347.20 is now in sight, having been identified as the next technical hurdle. Over the week, the stock has appreciated by more than 14%, and nearly 22.5% over a month, a surge that positions the price well above its three main moving averages: 10.76% above the MM20 (€300.20), 13.59% above the MM50 (€292.72), and 10.56% above the MM200 (€300.75). The RSI at 67 indicates this buying pressure without yet being in a marked overbought zone, while the MACD remains positive with a histogram at 2.27, confirming the strength of the momentum since early June.

Joint Venture with Theon in Drone Optronics and a Favorable Geopolitical Backdrop

Free · Every morning
Technical market signals, before the opening bell.
Bullish and bearish momentum, analyst changes, stocks to watch — automatically computed from Euronext data.
Before 9 AM every morning Euronext data AI-powered analysis

On the fundamentals side, Safran Electronics & Defense and Theon International signed a memorandum of understanding on June 15 to form a joint venture dedicated to onboard electro-optical and infrared systems for drones, a rapidly growing segment of the defense market. Concurrently, the US-Iran agreement announced at the G7 in Évian led to a sharp drop in Brent crude to around $80 per barrel, a relaxation that reduces pressure on the costs of the aerospace sector and benefits the entire value chain. The stock now shows a nearly 28% increase over the year, having aligned a series of technical breakouts (€305.70, then €306) over the last two weeks. The next reference point to watch remains the €347.20 resistance, which limits the short-term technical potential.


Sector Défense · Aéronautique / spatiale · Industrie Aérospatiale


Free · every morning · before 9am
Never miss a move on your stocks
The trend behind the prices · Euronext

Context

Period
  • Period: 2025
Key reported figures
  • Revenue: 31 189 M€
  • Revenue growth: 12,5 %
  • EBITDA: 6 318 M€
  • EBITDA margin: 20,3 %
  • Net income: 3 174 M€
  • Free cash flow: 3 921 M€
  • Dividend per share: 3,35 €
  • Payout ratio: 40 %
Guidance from the release
  • "2025 a été une année remarquable pour nos activités, portées par un trafic passagers record et une dynamique soutenue dans la défense."
  • Safran publie des résultats annuels 2025 solides: chiffre d'affaires consolidé de 31,189 milliards d'euros (+12,5 % YoY), résultat opérationnel courant consolidé de 4,787 milliards d'euros (+14,4 %), EBITDA de 6,318 milliards d'euros, cash-flow libre de 3,921 milliards d'euros; perspectives 2026: CA attendu en hausse de 12-15 %, COI entre 6,1 et 6,2 milliards d'euros et FCF entre 4,4 et 4,6 milliards d'euros, ambi tions 2028 relevées.
Risks mentioned
  • Capacités de production de la chaîne d’approvisionnement
Opportunities identified
  • Croissance soutenue des activités d’après-vente et défense
  • Livraisons et contenu des services liés au LEAP et à l’aéronautique civile
  • Dynamique du trafic aérien favorable et extension des commandes dans la défense
Outlook / guidance
  • Expected revenue: Le chiffre d'affaires 2026 est attendu entre 12 % et 15 % de hausse par rapport à l'année 2025.
  • Expected EBITDA: EBITDA 2026 attendu entre 6,1 et 6,2 milliards d'euros.
  • Management commentary: Pour 2026, Safran prévoit une croissance du chiffre d'affaires entre 12 % et 15 %, un résultat opérationnel courant entre 6,1 et 6,2 milliards d'euros et un flux de trésorerie libre entre 4,4 et 4,6 milliards d'euros, sous réserve de l'exécution des livraisons et du calendrier de paiement des États clients.

The information presented in this article is provided for informational purposes only and does not constitute an investment recommendation, an incentive to buy or sell a financial asset, or investment advice. Readers are invited to conduct their own research before making any decision.

Investments in the stock market involve risks, including the risk of capital loss. Past performance of an asset or market is no guarantee of future results. Any investment decision should be made taking into account your personal financial situation, objectives and risk tolerance.

Advertisement
Every morning
Technical market signals,
before the opening bell.
CAC 40 · SBF 120 · Signals · Analysts
🤖
Today's edition — pre-market
CAC 40
7 702
-0,87%
SBF 120
5 827
-0,87%
📈 Bullish signals
+5,2%
+1,8%
+0,9%
📉 Bearish signals
-14%
-5,7%
🔄 Analyst opinions
▲ 35 €
▼ 80 €
Sign up to see everything →
Before 9 AM every morning
Euronext data
AI-powered analysis


BOURSE · Chaque matin
La synthèse bourse,
avant l'ouverture.
Notre moteur analyse chaque nuit le CAC 40 et le SBF 120. Ce qui mérite attention remonte directement dans votre boîte mail. Gratuit.
Avant 9h00 1000+ inscrits 100% gratuit
Gratuit · chaque matin
Ne ratez plus rien sur vos actions
La tendance derrière les cours sur les valeurs Euronext, chaque matin avant 9h.
tendance · 6 séances
📈les valeurs en mouvement, sur la durée
🎯les objectifs d'analystes qui évoluent
📰les actualités qui font bouger les cours