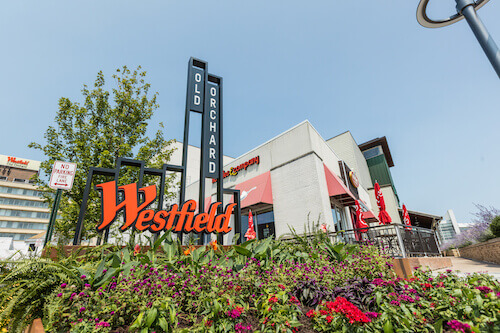
Unibail-Rodamco-WE Stock Falls 2% and Retests its 50-Day Moving Average
The commercial real estate company sees a significant decline in late afternoon trading, as the CAC 40 faces pressure following new military escalations in the Middle East. The stock erases part of its recent rebound and retests a key moving average, while the Paris index moves sharply lower.
The stock retests its 50-day moving average amidst a declining CAC 40
Unibail-Rodamco-Westfield shares fell by 2.09% to €100.95, within a CAC 40 that dropped 1.99% to 8,268 points during the session. Today's decline brings the stock back to its 50-day moving average, located at €100.60, which is a 0.35% difference above. However, the company remains significantly above its 200-day moving average at €94.93, maintaining a cushion of 6.3%, which preserves the medium-term upward trend.
The RSI at 56 remains in the neutral zone, consistent with a consolidation movement rather than a clear reversal. The session's context is tense: the American volatility measured by the VIX jumps nearly 11%, to 17.9, following the U.S. strikes in Iran and the claimed retaliation by Tehran against facilities in Kuwait and Bahrain.
A decline following several structural operations on the portfolio
Free · Every morning
Technical market signals, before the opening bell.
Bullish and bearish momentum, analyst changes, stocks to watch — automatically computed from Euronext data.
✓ Before 9 AM every morning✓ Euronext data✓ AI-powered analysis
You're in — subscription confirmed!
Your first edition is on its way. Check your spam folder and add us to your contacts.
An error occurred.
Indicative data. No investment advice. Unsubscribe at any time.
Gratuit · chaque matin
Ne ratez plus rien sur vos actions
La tendance derrière les cours. L'essentiel des valeurs Euronext en quelques minutes.
📈les valeurs en mouvement, sur la durée
🎯les objectifs d'analystes qui évoluent
📰les actualités qui font bouger les cours
tendance · 6 séances
✓ C'est fait, vous êtes inscrit !
Votre première édition arrive bientôt. Pensez à vérifier vos spams.
Une erreur est survenue.
CAC 40 · SBF 120 · données indicatives · aucun conseil en investissement · désinscription à tout moment.
Today's movement comes after a busy corporate period for the real estate firm. On June 25, the group completed the legal reorganization making URW SE the sole listed entity on Euronext Paris. Earlier in June, the group had announced a conditional agreement to acquire the remaining 50% of Westfield UTC in San Diego for approximately $705 million, with a closing targeted by the end of 2026.
Despite today's drop, the performance over twelve months remains strong, at over 25%. The next technical threshold to watch is the 50-day moving average at €100.60: breaking below it would pave the way to the identified support at €95.00.
we have confidence in the Group's financial trajectory despite the volatile geopolitical and macroeconomic environment
Outlook / guidance
Management commentary: 2026 Adjusted Recurring Earnings per Share (AREPS) expected to be within its guidance of €9.15 to €9.30. The Group expects its 2026 AREPS to be within its guidance of €9.15 to €9.30. This guidance is supported by year-to-date strong operating performance, which the Group sees continuing. It also reflects the impact of the Group's disposals, acquisitions and its refinancings. The Group confirms that it will propose a €5.50 per share distribution for fiscal year 2026 announced in February, representing a c. 22% increase from the €4.50 paid for fiscal year 2025.
The information presented in this article is provided for informational purposes only and does not constitute an investment recommendation, an incentive to buy or sell a financial asset, or investment advice. Readers are invited to conduct their own research before making any decision.
Investments in the stock market involve risks, including the risk of capital loss. Past performance of an asset or market is no guarantee of future results. Any investment decision should be made taking into account your personal financial situation, objectives and risk tolerance.