Idéal Investisseur
Français English
CAC 40 : Market open
8 078,47 pts
-0.48%


Last updated : 15/09/2026 - 16h49
🏠 Home   ➤    Stock news

Thales Shares Jump 2% Testing Key Technical Threshold at 254 Euros

Thales shares saw a notable rise this Wednesday midday, climbing 2.09% to 254.10 euros, after closing at 248.90 euros the previous day. This increase occurs during a favorable session for the CAC 40, which is up 0.89%. Over three months, the defense electronics group's stock has accumulated a gain of 11.69%.
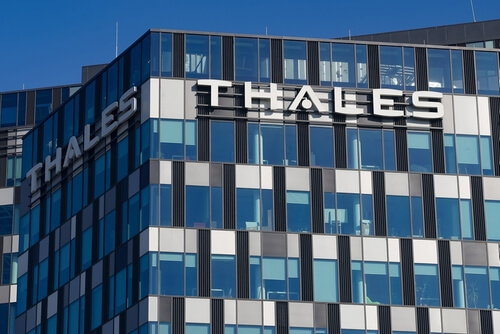

Thales Shares Jump 2% Testing Key Technical Threshold at 254 Euros

Approaching Key Technical Levels

Trading at 254.10 euros, Thales is nearing its 50-day moving average, located at 255.15 euros, a technical threshold that has acted as a ceiling in recent weeks. Closing above this level could signal a bullish trend for traders. The stock remains comfortably above its 200-day moving average (244.96 euros), indicating a still favorable underlying trend despite recent fluctuations. The RSI, an indicator measuring the relative strength of the movement, stands at 46, a neutral zone that leaves room for an upward movement before entering overbought territory. Should the rebound continue, the next significant technical resistance is identified at 264.40 euros.

Amidst a Broad Market Rebound

Free · Every morning
Technical market signals, before the opening bell.
Bullish and bearish momentum, analyst changes, stocks to watch — automatically computed from Euronext data.
Before 9 AM every morning Euronext data AI-powered analysis

Thales' progress occurs in the context of a generalized rebound across European markets. The SBF 120, an index that includes the group, is up 0.93% during the session. Other European-listed technology and industrial stocks are also posting notable gains: Schneider Electric is up 3.51% and ASML has advanced 1.63%. However, this bullish movement unfolds in an environment of persistent market tension, with the VIX — the S&P 500 volatility index — remaining high at 27.19, a level indicating higher-than-normal market nervousness. Thales' particularly low beta of 0.12 suggests that the stock has very low sensitivity to general market movements, which may explain its unique trajectory during periods of uncertainty. The group's general meeting, scheduled for May 12, will be the next key event on the financial calendar for shareholders.


Sector Aéronautique et Défense Défense


Free · every morning · before 9am
Never miss a move on your stocks
The trend behind the prices · Euronext

Context

Period
  • Period: S1 2026
Key reported figures
  • Revenue: 10 949 millions d'euros
  • Quarterly revenue: 10 949 millions d'euros
  • Revenue growth: 6,7 %
  • EBITDA: 1 150 millions d'euros
  • Net income: 485 millions d'euros
  • Free cash flow: 1 865 millions d'euros
  • 519,2 millions d'euros
Risks mentioned
  • Résiliation du programme F126 par l'Allemagne : charge exceptionnelle de 450 M€, impact de 331 M€ sur le résultat net
  • Annulation d'une commande de deux satellites géostationnaires, impact d'environ -150 M€ sur les ventes Spatial
  • Marge Cyber & Digital en baisse à 10,9 % contre 14,4 %, notamment dans les Paiements et l'Identité/Biométrie
Opportunities identified
  • 18 grandes commandes de plus de 100 M€ pour 4 850 M€, dont 11 au deuxième trimestre
  • Carnet de commandes Défense de 41,1 milliards d'euros, soit environ 3,2 années de chiffre d'affaires
  • Très forte progression au Proche et Moyen-Orient (+202 % en organique en prises de commandes)
Outlook / guidance
  • Expected revenue: 23 600 millions d'euros
  • Management commentary: Organic sales growth expected between +6% and +7%, corresponding to sales of €23.3 to €23.6 billion; Adjusted EBIT margin expected between 12.6% and 12.8%

The information presented in this article is provided for informational purposes only and does not constitute an investment recommendation, an incentive to buy or sell a financial asset, or investment advice. Readers are invited to conduct their own research before making any decision.

Investments in the stock market involve risks, including the risk of capital loss. Past performance of an asset or market is no guarantee of future results. Any investment decision should be made taking into account your personal financial situation, objectives and risk tolerance.

Advertisement
Every morning
Technical market signals,
before the opening bell.
CAC 40 · SBF 120 · Signals · Analysts
🤖
Today's edition — pre-market
CAC 40
7 702
-0,87%
SBF 120
5 827
-0,87%
📈 Bullish signals
+5,2%
+1,8%
+0,9%
📉 Bearish signals
-14%
-5,7%
🔄 Analyst opinions
▲ 35 €
▼ 80 €
Sign up to see everything →
Before 9 AM every morning
Euronext data
AI-powered analysis


BOURSE · Chaque matin
La synthèse bourse,
avant l'ouverture.
Notre moteur analyse chaque nuit le CAC 40 et le SBF 120. Ce qui mérite attention remonte directement dans votre boîte mail. Gratuit.
Avant 9h00 1000+ inscrits 100% gratuit
Gratuit · chaque matin
Ne ratez plus rien sur vos actions
La tendance derrière les cours sur les valeurs Euronext, chaque matin avant 9h.
tendance · 6 séances
📈les valeurs en mouvement, sur la durée
🎯les objectifs d'analystes qui évoluent
📰les actualités qui font bouger les cours