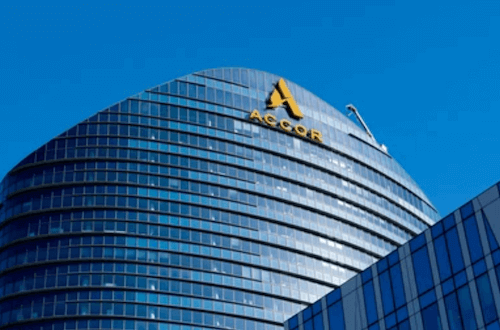
Accor Share Falls 3%, Among the Steepest Declines on the CAC 40
The multi-brand hotel group is losing ground mid-morning, as the CAC 40 retreats. The stock weighs on the lower end of the Paris index, three days ahead of the publication of its third quarter results.
A Decline More Pronounced Than That of the Index, Which Brings the Stock Back to Its Moving Averages
The Accor share is down 3.13% to €45.43 during the session, compared to 1.38% for the CAC 40. It holds the second-to-last position on the index, just behind Stellantis, which is last with -3.88%. With a performance of 0.09% over seven days, the stock had nonetheless returned to equilibrium before this decline.
The price is now in contact with its 20-day moving average (€45.44) and 1% below its 50-day moving average (€45.90) as well as its 200-day moving average (€45.86). The support level at €43.70 stands approximately 4% lower, while the resistance level at €47 is within reach of a rebound, which bounds the recent fluctuation zone.
Third Quarter Results Expected Thursday, Following a First Half That Set the EBITDA Trajectory
Free · Every morning
Technical market signals, before the opening bell.
Bullish and bearish momentum, analyst changes, stocks to watch — automatically computed from Euronext data.
✓ Before 9 AM every morning✓ Euronext data✓ AI-powered analysis
You're in — subscription confirmed!
Your first edition is on its way. Check your spam folder and add us to your contacts.
An error occurred.
Indicative data. No investment advice. Unsubscribe at any time.
Gratuit · chaque matin
Ne ratez plus rien sur vos actions
La tendance derrière les cours. L'essentiel des valeurs Euronext en quelques minutes.
📈les valeurs en mouvement, sur la durée
🎯les objectifs d'analystes qui évoluent
📰les actualités qui font bouger les cours
tendance · 6 séances
✓ C'est fait, vous êtes inscrit !
Votre première édition arrive bientôt. Pensez à vérifier vos spams.
Une erreur est survenue.
CAC 40 · SBF 120 · données indicatives · aucun conseil en investissement · désinscription à tout moment.
The group is publishing its third quarter 2026 results on October 22. Upon publication of H1 2026 on July 29, it had set an EBITDA target of €1,272.5 million for the fiscal year. The group is furthermore continuing its share buyback program of €225 million, announced on July 30 and executed at approximately 24% as of October 2.
SectorTourisme, hôtellerie et restauration›Groupes hôteliers
Free · every morning · before 9am
Never miss a move on your stocks
The trend behind the prices · Euronext
✓ You're in! Check your spam folder.
An error occurred.
Context
Period
Period: S1 2026
Key reported figures
Revenue: 2 760 millions d'euros
Quarterly revenue: 2 760 millions d'euros
EBITDA: 450 millions d'euros
EBITDA margin: 20,4 %
Net income: 114 millions d'euros
Free cash flow: 194 millions d'euros
3 523 millions d'euros
Outlook / guidance
Expected EBITDA: 1 273 millions d'euros
Management commentary: Un EBE courant entre 1 260 millions d'euros et 1 285 millions d'euros sur la base d'un impact de change négatif de 10 millions d'euros attendu pour l'exercice 2026
The information presented in this article is provided for informational purposes only and does not constitute an investment recommendation, an incentive to buy or sell a financial asset, or investment advice. Readers are invited to conduct their own research before making any decision.
Investments in the stock market involve risks, including the risk of capital loss. Past performance of an asset or market is no guarantee of future results. Any investment decision should be made taking into account your personal financial situation, objectives and risk tolerance.