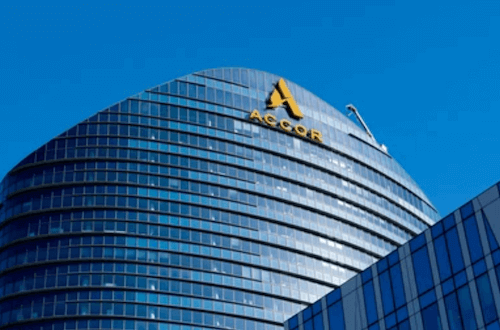
Accor Shares Drop 7% in a Week, Breaking Key Technical Support
Accor shares continue their downward trend this Thursday, March 12, dropping 1.8% to 42.09 euros midday. The hotel group now shows a decline of over 7% in seven days, amid a general weakness in European markets, with the CAC 40 down 0.39% during the session.
The trajectory of Accor has significantly worsened in recent weeks. After losing 8.9% over three months, the share price is now well below its 50-day and 200-day moving averages, which stand at 47.03 euros and 45.14 euros, respectively. This increasing gap indicates an acceleration of selling pressure. The Relative Strength Index (RSI) is at 32, close to the so-called oversold zone set at 30. This level indicates that the stock has undergone significant sell-offs recently, yet it does not automatically signal a rebound. Moreover, the price has broken below the technical support identified at 42.45 euros, potentially paving the way for a continued downward movement if this threshold is not quickly reclaimed.
Accor's Decline Exceeds Market Averages
Free · Every morning
Technical market signals, before the opening bell.
Bullish and bearish momentum, analyst changes, stocks to watch — automatically computed from Euronext data.
✓ Before 9 AM every morning✓ Euronext data✓ AI-powered analysis
You're in — subscription confirmed!
Your first edition is on its way. Check your spam folder and add us to your contacts.
An error occurred.
Indicative data. No investment advice. Unsubscribe at any time.
Gratuit · chaque matin
Ne ratez plus rien sur vos actions
La tendance derrière les cours. L'essentiel des valeurs Euronext en quelques minutes.
📈les valeurs en mouvement, sur la durée
🎯les objectifs d'analystes qui évoluent
📰les actualités qui font bouger les cours
tendance · 6 séances
✓ C'est fait, vous êtes inscrit !
Votre première édition arrive bientôt. Pensez à vérifier vos spams.
Une erreur est survenue.
CAC 40 · SBF 120 · données indicatives · aucun conseil en investissement · désinscription à tout moment.
Accor's decline this Thursday significantly exceeds that of the CAC 40, which is down 0.39% at 8,010.11 points during the session. The SBF 120 shows a comparable decline of 0.34% at 6,064.43 points. The magnitude of the hotel group's underperformance, with a drop of 1.8% in just one day, illustrates a dynamic specific to the stock that goes beyond the general market gloom. Over the past year, the stock has posted a negative performance of 4.3%, while monthly volatility remains high at 12.71%. This situation reflects a prolonged period of uncertainty for the stock, which is trading more than ten euros below its major technical resistance of 49.78 euros. In the absence of identified catalysts, today's session confirms the bearish trend that has been in place for several weeks in the stock of Europe's leading hotel group.
SectorTourisme, hôtellerie et restauration›Groupes hôteliers
Free · every morning · before 9am
Never miss a move on your stocks
The trend behind the prices · Euronext
✓ You're in! Check your spam folder.
An error occurred.
Context
Period
Period: T3 2026
Key reported figures
Revenue: 1 503 millions d'euros
Quarterly revenue: 1 503 millions d'euros
Revenue growth: 9,8 %
Guidance from the release
Ces performances solides et la poursuite d'une discipline financière rigoureuse dans un contexte géopolitique incertain nous permettent de relever notre objectif de résultats pour l'année.
Risks mentioned
Situation aux Émirats Arabes Unis restant impactée par le conflit au Moyen-Orient avec un RevPAR en baisse de l'ordre de 20%
Environnement géopolitique incertain mentionné comme contexte de risque
Variation négative du RevPAR en Chine continuant sur le trimestre
Opportunities identified
Croissance dynamique de la division Luxe & Lifestyle avec RevPAR en hausse de 8,3%
Croissance nette du réseau de 3,0% et pipeline en croissance de 9,5% offrant perspectives d'expansion
Pipeline de plus de 273 000 chambres (1 628 hôtels) constituant un levier de croissance futur
Outlook / guidance
Expected EBITDA: 1 278 millions d'euros
Management commentary: For fiscal year 2026, Accor is revising the following outlook: [...] Recurring EBITDA in the range of €1,270 million to €1,285 million (previously "between €1,260 million and €1,285 million"), based on an expected negative €10 million foreign exchange impact for fiscal year 2026
The information presented in this article is provided for informational purposes only and does not constitute an investment recommendation, an incentive to buy or sell a financial asset, or investment advice. Readers are invited to conduct their own research before making any decision.
Investments in the stock market involve risks, including the risk of capital loss. Past performance of an asset or market is no guarantee of future results. Any investment decision should be made taking into account your personal financial situation, objectives and risk tolerance.