

Air France-KLM stock declines 2.5% and threatens its 11.38 € support level
Air France-KLM stock is falling sharply in mid-trading on Monday, September 14, amid significant tensions in oil prices, with Brent exceeding 107 dollars this morning. The security is now trading in a deteriorated technical configuration, below two of its three moving averages, in a Paris market itself oriented downward.
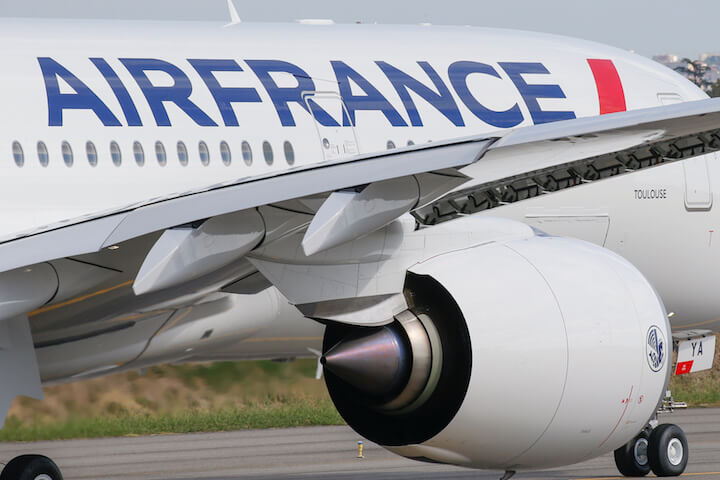
Brent above 107 dollars weighs on the airline sector, CAC 40 declines 0.8%
Brent climbed to 108.41 dollars per barrel during the session, up 3.5%, before returning to around 107.5 dollars, driven by geopolitical tensions around the Strait of Hormuz and the closure of the Saudi East-West pipeline following drone attacks. For an airline company like Air France-KLM, where fuel represents one of the largest cost items, this surge aggravates pressure on margins in the short term. The CAC 40 is down 0.80% during the session, in a context of a "super week" for central banks: the Fed meets on Wednesday, the Bank of England on Thursday and the Bank of Japan on Friday, while American inflation came in at 3.4% in August, strengthening the probability of another rate hike.
The ECB, for its part, raised its key interest rates by 25 basis points on September 10. This context of global monetary tightening and high energy costs fuels risk aversion on cyclical and rate-sensitive stocks, of which airlines are a part. Over the past week, Air France-KLM shares have fallen 3.11%, extending a monthly decline of 7.34%.
The security below its short and medium-term moving averages, the 11.38 € support under pressure
At 11.36 €, the stock declines 2.41% and finds itself below its MA20 at 11.74 € (gap of -3.28%) and its MA50 at 12.20 € (gap of -6.93%), reflecting a negative underlying trend over the short and medium-term horizon. The only technical support remains the MA200, at 11.24 €, which the price still slightly exceeds (+1.02%). It is precisely at this level that the support threshold identified at 11.38 € is also situated, or less than half a percent from the current price. With an RSI at 44, the security is not yet in frank oversold territory, which leaves room for further deterioration without a signal of selling exhaustion.
The ranking in the SBF 120 reflects the pressure: with a decline of 2.41%, the security is among the lowest performers on the index in this session. As a reminder, when the group published its H1 2026 results on July 30, it adopted a cautious tone, mentioning a "particularly volatile" environment and revised capacity outlook. The group is trading at approximately 3.3 times expected earnings for the current fiscal year, according to the consensus of surveyed analysts. The holding of the 11.38 € support, which coincides with the MA200, will be the technical benchmark to monitor in the coming sessions.


