

Atos Becomes the Worst Performer in the SBF 120, Profit-Taking After the Rally
Atos stock plummets during the session, becoming the worst performer in the SBF 120 by midday. The decline follows several weeks of recovery and a steady flow of commercial contracts. The session contrasts with a broadly lower market index.
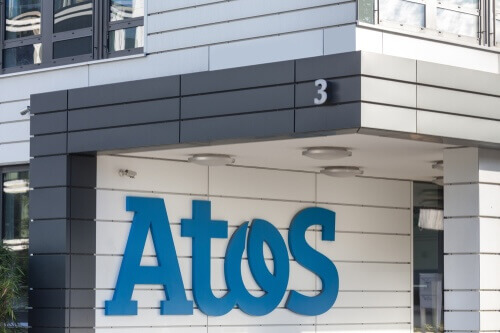
Atos the Worst Performer in the SBF 120 Despite New Partnership
Atos falls by 4.18% to €40.36, down from €42.12 the previous day, marking the sharpest decline in the SBF 120 by mid-morning. The broader index loses 0.26% at the same time, with the CAC 40 down by 0.32%. This movement occurs as the group formalizes its innovation partnership with CONMEBOL eLibertadores on Thursday, an extension of the agreement made in December 2025 with the South American confederation. The announcement, unlikely to have a material effect on the accounts, does not stop the profit-taking. The stock maintains a year-on-year gain of 7.63%, but now shows almost no decline for the week, after several sessions of rebound fueled by a sustained flow of commercial contracts.
Stock Remains Below the €45.22 Resistance Despite a RSI at 62
The session extends the halt that began earlier in the week, when the stock had already stalled under its resistance. At €40.36, the price remains above its short-term moving averages (MM20 at €38.11, MM50 at €36.80), but still below the MM200 at €44.94, a gap of 10.19%. The €45.22 resistance thus limits the rebound, while the support at €32.66 remains more than 19% away. An RSI at 62 indicates a still positive momentum without excess, and the MACD remains upwardly oriented with a histogram at +0.59. Today's movement resembles a technical digestion after the May rally, in a Paris market weakened by the upheavals of the Iranian dossier and rising oil prices. The next milestone for the stock will be the crossing, or not, of the 200-day moving average at €44.94.


